
Cctop Debug
- 70 repo stars
- Updated July 26, 2026
- DeanLa/cctop
Debug logger for cctop — logs full hook event payloads to per-session JSONL files.
About
cctop-debug is a Claude Code skill in the Debugging category. Debug logger for cctop — logs full hook event payloads to per-session JSONL files.
- cctop-debug
- Debugging
- AI-coding skill
Cctop Debug by the numbers
- Data as of Jul 27, 2026 (Skillselion catalog sync)
/plugin marketplace add DeanLa/cctop/plugin install cctop-debug@cctopAdd your badge
Show developers this skill is listed on Skillselion. Paste this into your README.

| repo stars | ★ 70 |
|---|---|
| Last updated | July 26, 2026 |
| Repository | DeanLa/cctop ↗ |
What it does
Debug logger for cctop — logs full hook event payloads to per-session JSONL files.
README.md
cctop

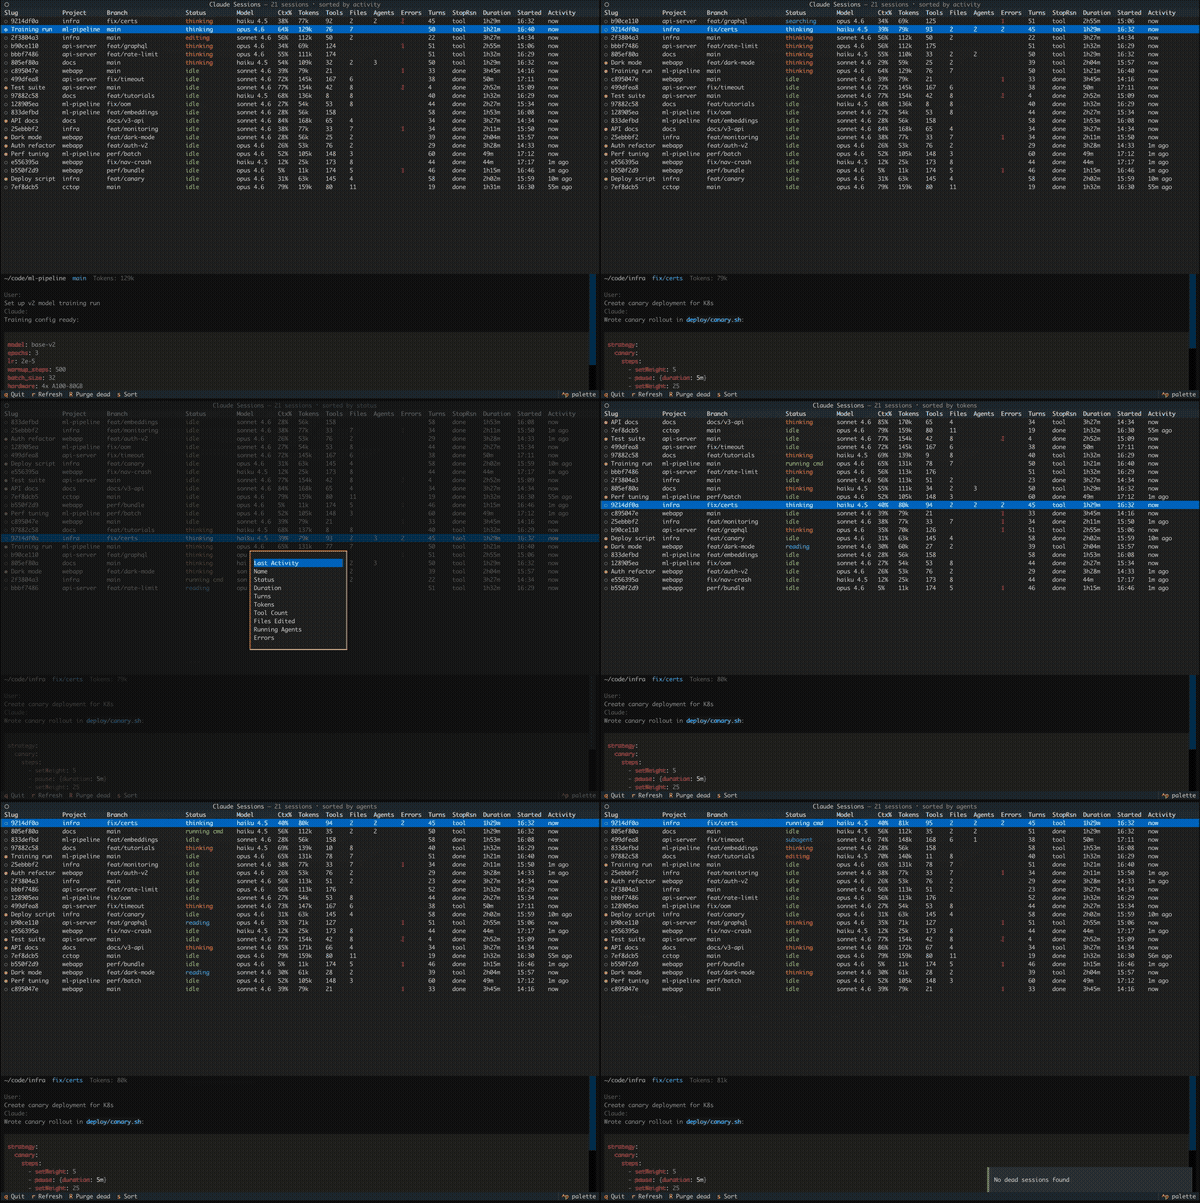
Like htop, but for Claude Code. A live terminal dashboard that shows all your sessions at a glance, status, context usage, tokens, and latest messages.
Install
Requires Claude Code, uv, and jq.
curl -fsSL https://raw.githubusercontent.com/DeanLa/cctop/main/install.sh | bash
Then launch from any terminal:
cctop
Why
If you're past the "one session at a time" stage but not running a fleet of headless agents, you're in the middle ground where most tools don't help. You have 4-20 sessions open across multiple projects, refactoring one repo while tests run in another, firing off a prompt in a third while waiting for a fourth to finish. You context-switch constantly, lose track of which tab is blocked on you, and forget what that session in the background was even doing.
cctop gives you one screen to see all of them.
What You See
Keybindings
| Key | Action |
|---|---|
q |
Quit |
r |
Force refresh |
R |
Purge dead sessions (PID check + staleness fallback) |
s |
Open sort picker (activity, name, status, duration, turns, tokens, tools, files, agents, errors) |
ctrl+p |
Open command palette (switch theme, etc.) |
Columns
| Column | What it shows |
|---|---|
| Name | Session display name (custom title or directory slug) |
| Project | Working directory name |
| Branch | Git branch (truncated to 20 chars) |
| Status | Granular activity status (see below) |
| Model | Model family and version (e.g. "sonnet 4.6", "opus 4.6") |
| Ctx% | Context window usage percentage |
| Tokens | Total tokens consumed (e.g. "145k") |
| Tools | Tool call count |
| Files | Number of files edited |
| Agents | Running subagents |
| Errors | Error count (highlighted in red) |
| Turns | Conversation turn count (user-assistant exchanges) |
| StopRsn | Last stop reason (done, tool, limit) |
| Duration | Elapsed time since session start (e.g. "1h23m") |
| Started | Session start time (e.g. "14:30") |
| Activity | Time since last event (e.g. "2m ago") |
Highlight any row to see a detail panel with the full working directory, git branch, token breakdown, files edited, subagent and error counts, the last user prompt, and Claude's last response.
Status Labels
The Status column shows what each session is doing right now:
| Status | Color | Meaning |
|---|---|---|
| idle | green | Waiting, no action needed |
| awaiting plan | blue | Plan ready for your review |
| needs input | orange | Blocked on a question from Claude |
| awaiting permission | orange | Waiting for you to approve a tool use |
| thinking | yellow | Claude is generating a response |
| planning | blue | Session is in plan mode (reading/searching for the plan) |
| editing | orange | Writing or editing files |
| running cmd | green | Executing a shell command |
| searching | cyan | Searching files (Glob/Grep) |
| reading | cyan | Reading files |
| searching web | magenta | Web search or fetch |
| subagent | purple | Running a subagent |
| reviewing | purple | Running a code review subagent |
| researching | purple | Running an explore/research subagent |
| mcp:server | magenta | Using an MCP tool (e.g. mcp:atlassian) |
| error: type | red | Hit an error (rate limit, auth failed, etc.) |
| stale | dim | No activity for 1+ hour |
Session Lifecycle
Sessions that go quiet for 1+ hour are marked stale. Sessions that end clean up after themselves. Sessions whose Claude process has exited (e.g. Ctrl+C) are automatically removed by the background poller via PID checks. Press R to manually purge dead sessions, or run cctop --reset to wipe all session data and start fresh.
A health check bar may appear at the bottom of the dashboard when cctop detects a mismatch between tracked sessions and running Claude processes. This is normal if you had sessions running before installing cctop.
Configuration
cctop stores settings in ~/.cctop/config.toml. All settings are saved automatically as you use the dashboard:
[ui]
theme = "textual-dark"   # any Textual built-in theme (ctrl+p to change)

[sort]
column = "activity"      # column key to sort by
reverse = true           # sort direction

[columns]
hidden = []              # list of hidden column keys
Theme, sort, and column visibility all persist across restarts. The --reset flag clears session data but preserves your config.
Troubleshooting
No sessions appear after install
- Make sure
jqis installed (jq --version). The hook requires it and silently does nothing without it. - Only sessions started after installing cctop are tracked. Existing sessions won't appear until they are restarted.
- Try running
cctop --resetto clear stale data and start fresh.
Orange warning bar at the bottom
- "N sessions not tracked" means Claude processes are running that cctop doesn't know about. This is expected for sessions that started before cctop was installed.
- "N stale sessions detected" means tracked sessions whose process has exited. Press
Rto purge them.
Uninstall
Remove the plugin and CLI entry point:
rm -rf ~/.claude/plugins/cache/cctop
rm -f ~/.local/bin/cctop
rm -rf ~/.cctop
Contributing
Contributions welcome! See CONTRIBUTING.md for development setup, architecture, and testing.
License
Related skills
 Azure DiagnosticsSystematically diagnose and resolve production issues on Microsoft Azure using official Microsoft guidance.495k1.3kAzure MessagingQuickly diagnose and fix connection, authentication, and message-processing failures when using Azure Event Hubs or Service Bus SDKs.483k1.3k
 Diagnosing BugsGet a systematic, step-by-step process that surfaces the real root cause instead of guessing at bugs.291k200k
 Use My BrowserWhen their agent task requires access to the live browser session, rendered DOM state, authenticated dashboards, localhost apps, or DevTools-selected elements instea269k71
 Systematic DebuggingFollow a repeatable four-phase process that forces root-cause discovery before any code changes.210k265k
 Safe DebugGet conservative, non-destructive diagnosis of deep learning and agent errors before any code changes are made.185k512