
Arc Probe
- 15 repo stars
- Updated March 20, 2026
- vzco/arc-probe
Process memory inspector for AI agents — 31 RE skills, disassembly, RTTI, breakpoints, struct mapping
About
arc-probe is a Claude Code skill in the AI & Agent Building category. Process memory inspector for AI agents — 31 RE skills, disassembly, RTTI, breakpoints, struct mapping
- arc-probe
- AI & Agent Building
- AI-coding skill
Arc Probe by the numbers
- Data as of Jul 7, 2026 (Skillselion catalog sync)
/plugin marketplace add vzco/arc-probe/plugin install arc-probe@arc-probeAdd your badge
Show developers this skill is listed on Skillselion. Paste this into your README.

| repo stars | ★ 15 |
|---|---|
| Last updated | March 20, 2026 |
| Repository | vzco/arc-probe ↗ |
What it does
Process memory inspector for AI agents — 31 RE skills, disassembly, RTTI, breakpoints, struct mapping
README.md
arc probe
if cheat engine and claude had a baby.
arc probe is a real-time process memory inspector built for AI agents. inject a DLL into any Windows x64 process, then read memory, disassemble x86-64, scan patterns, set breakpoints, resolve RTTI — all through structured JSON over TCP.
the GUI exists to show the human what the AI is doing. a human can drive it. claude can drive it. or both can work together.
- 65 commands over TCP — memory read/write, disassembly, RTTI, pattern scan, breakpoints, hooks, threads
- agent-first design — Claude Bridge API lets AI control the GUI programmatically
- struct editor with live memory values and recursive pointer drill-down
- works with any x64 process — no game-specific code required
status: early access. download binaries from Releases, install the Claude Code plugin, and start inspecting.
what it looks like
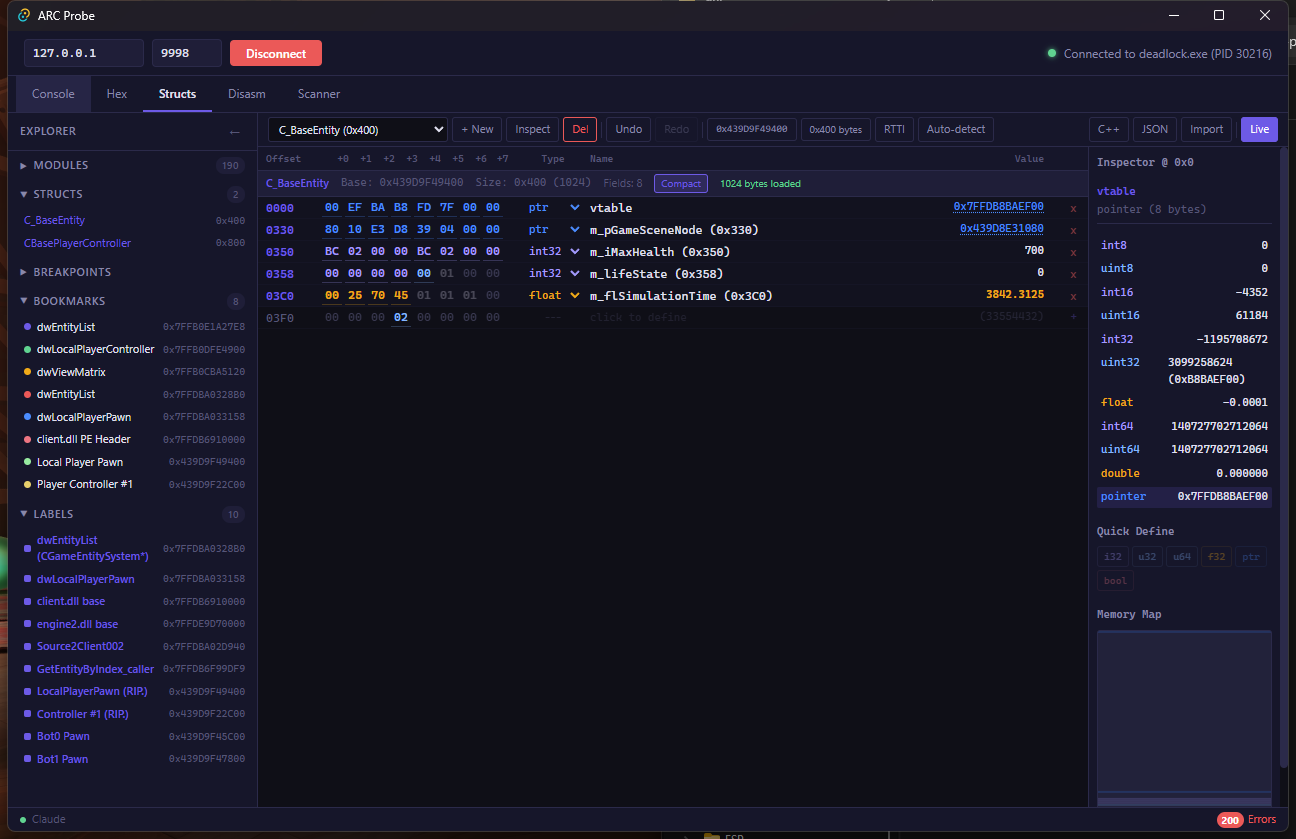
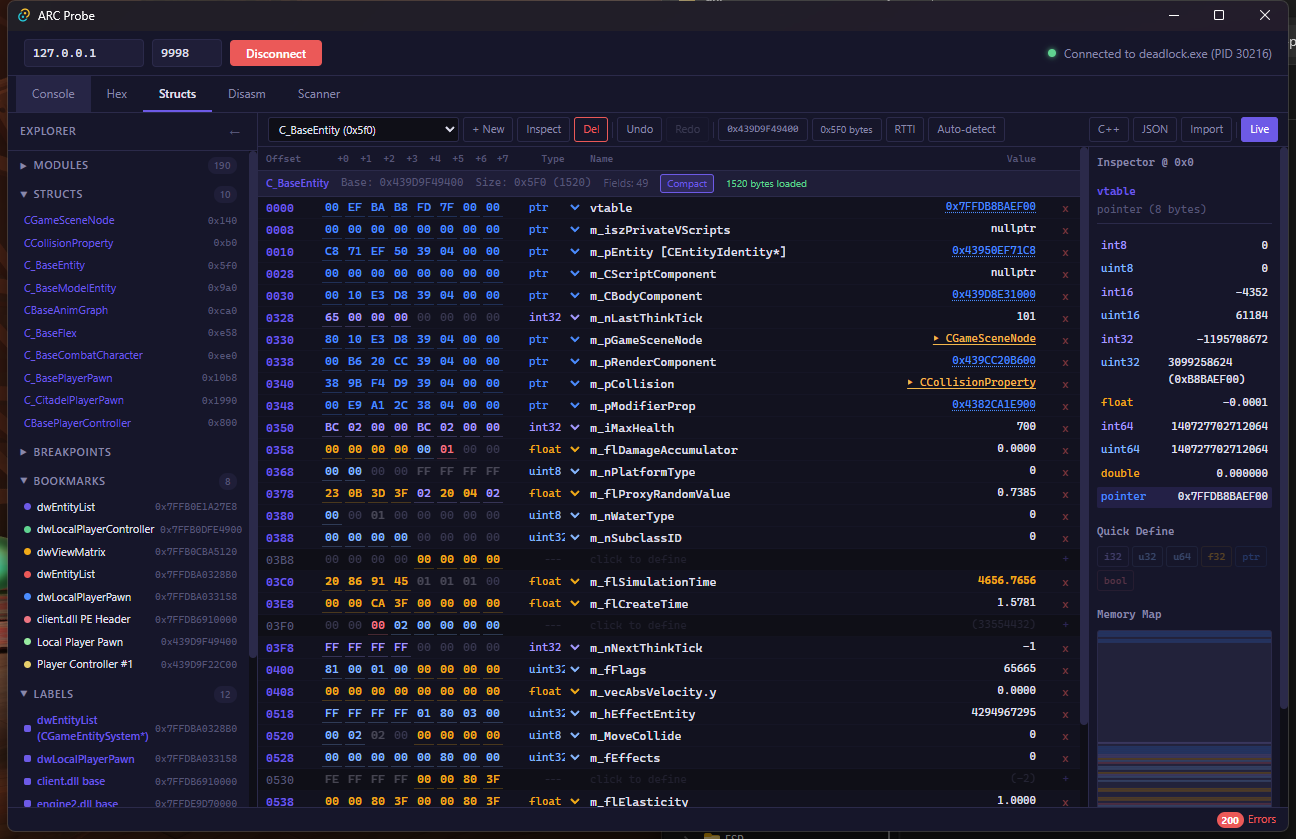
struct editor — live memory values
define structs from schema dumps or manually, then watch values update in real-time. pointer fields expand inline to show nested structures. the AI builds these programmatically through the Claude Bridge.
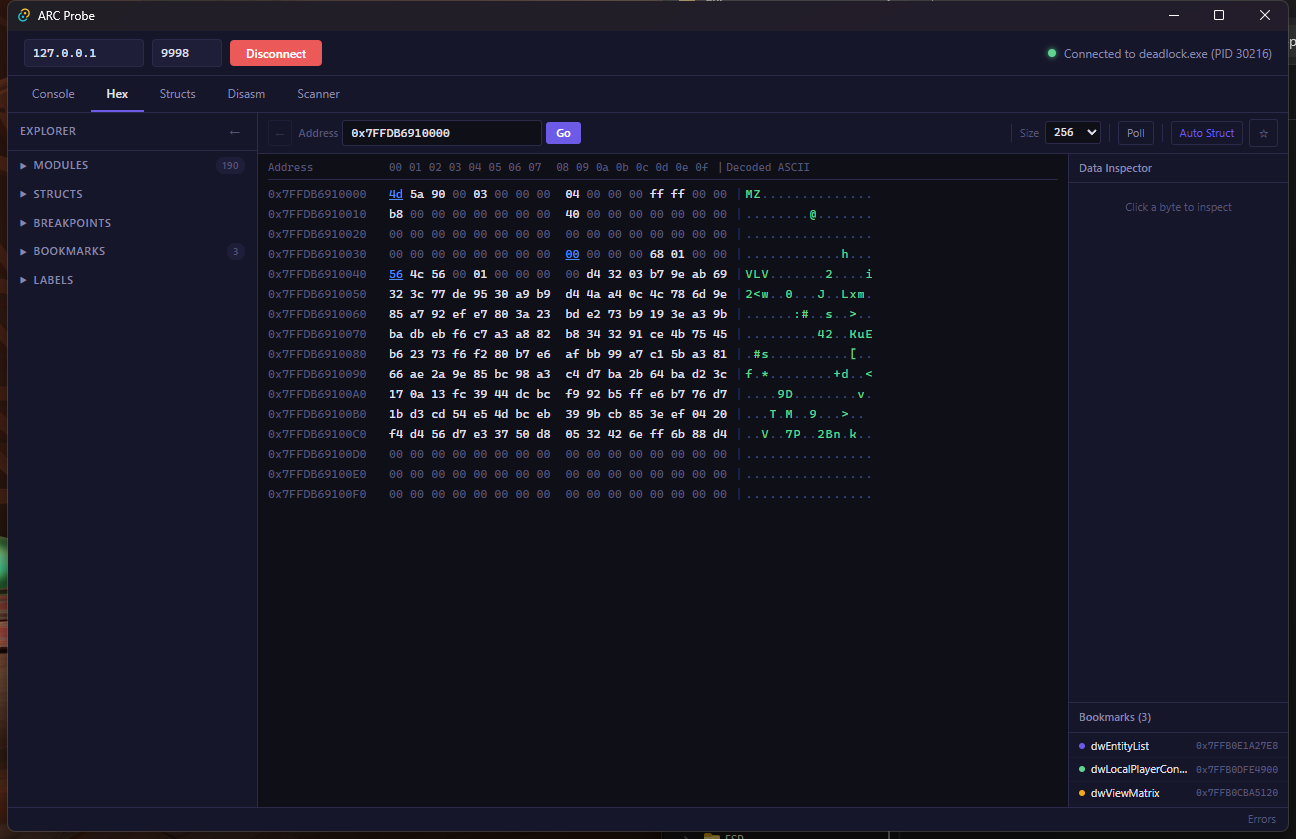
hex viewer
navigate any address in the process. PE headers, entity memory, vtables — click any byte to see every type interpretation in the data inspector. bookmarks and labels for quick navigation.
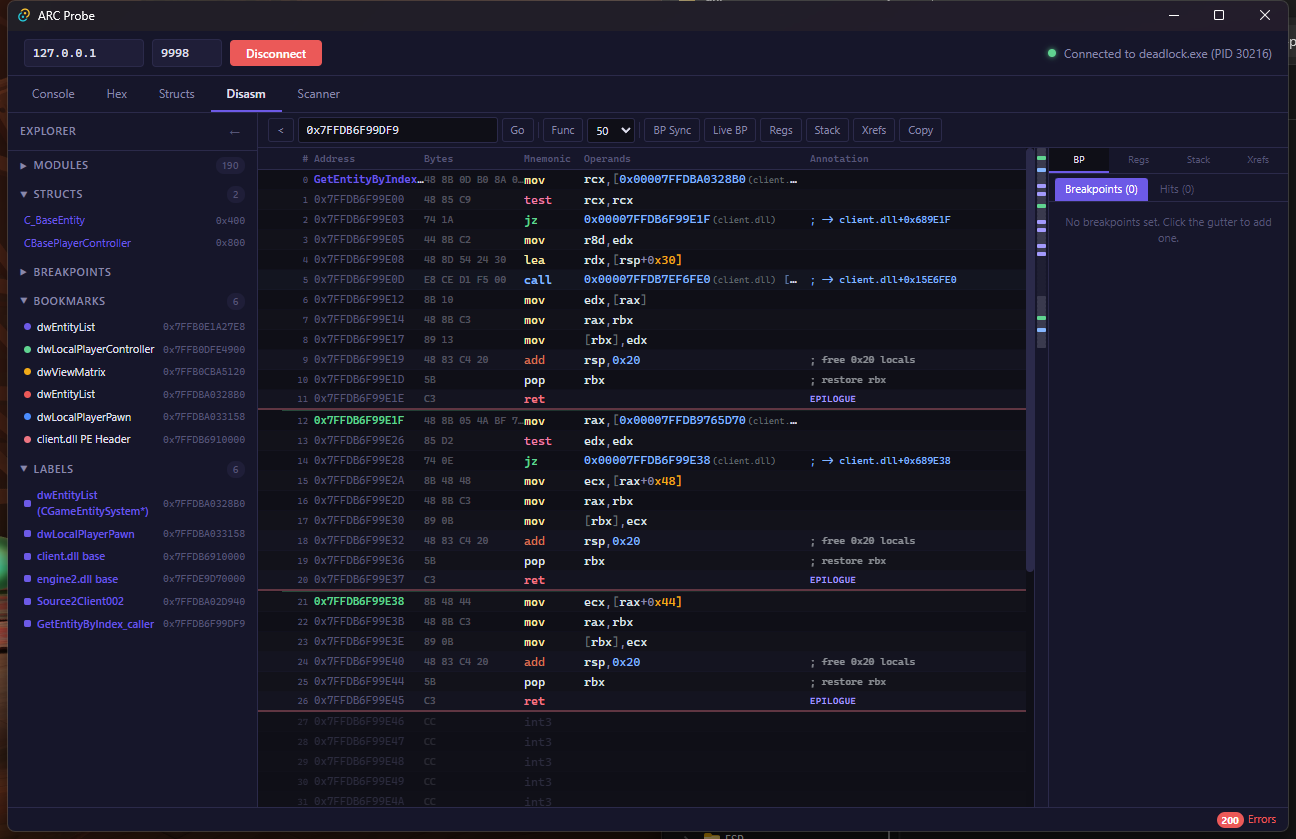
disassembler
color-coded x86-64 disassembly with resolved addresses and labels. trace function calls, identify globals via RIP-relative addressing, understand code flow.
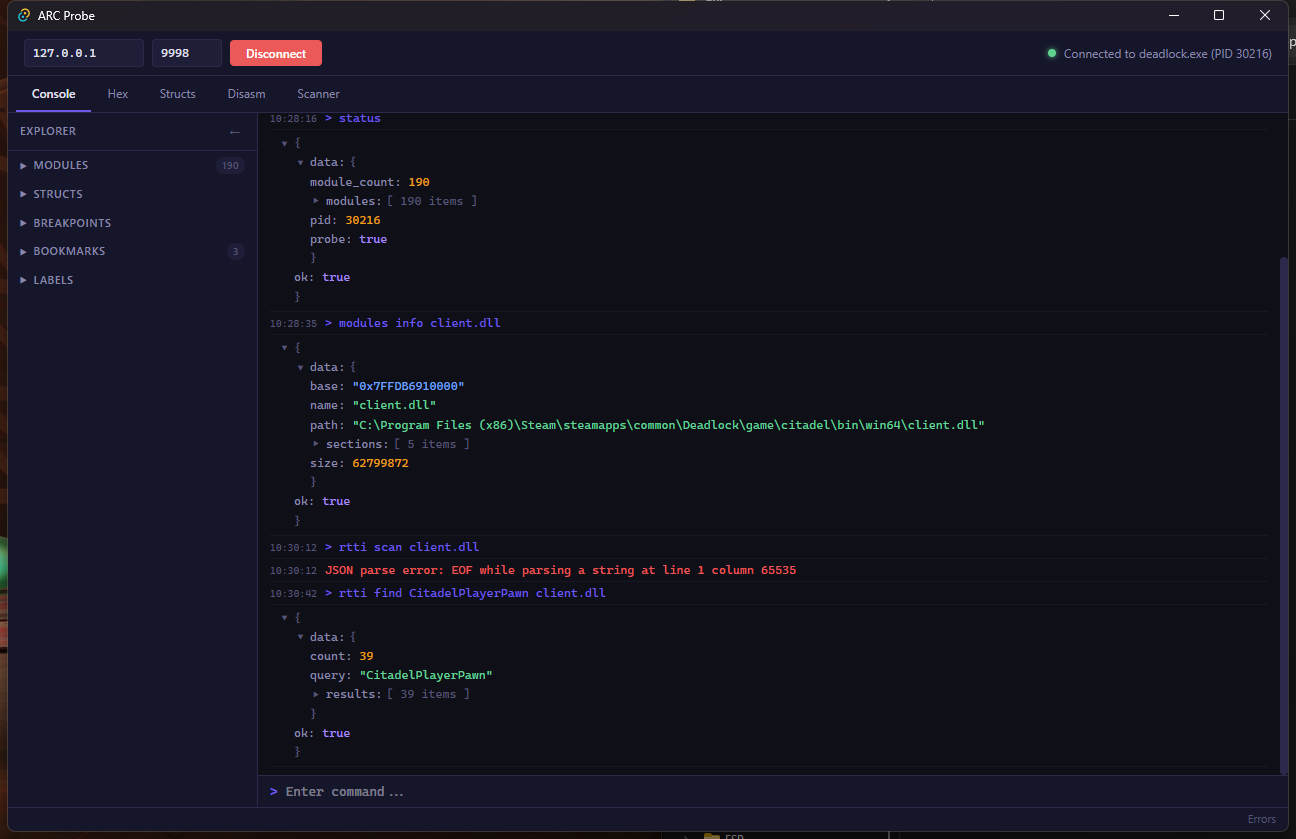
console — structured JSON
every command returns structured JSON. the console renders it with syntax highlighting and collapsible trees. type commands directly or let the AI drive.
struct hierarchy — full inheritance chain
the AI built 12 struct definitions covering a 14-level C++ inheritance chain — 218 fields total — all from schema dumps + live memory verification. pointer drill-down lets you expand nested structs inline.
get started
1. download
grab the latest release from Releases. extract the zip — you get three files:
| file | size | what it does |
|---|---|---|
probe-shell.dll |
2.7 MB | the injected DLL — TCP server with 65 commands, Zydis disassembler, VEH breakpoints, RTTI scanner |
probe-inject.exe |
710 KB | manual-map DLL injector — no LoadLibrary, DLL won't show in module list |
probe.exe |
910 KB | CLI client — sends a command, prints JSON, exits. REPL mode with no args |
add the folder to your PATH or use full paths. needs Windows 10/11 x64 and administrator privileges.
2. inject and explore
# inject into any running process
probe-inject.exe notepad.exe

# health check
probe.exe ping
# {"ok":true,"data":{"response":"pong"}}

# what's loaded?
probe.exe --pretty status

# hex dump the PE header
probe.exe "dump 0x7FF701AB0000 64"

# disassemble 5 instructions
probe.exe "disasm 0x7FF701AB1000 5"

# find all C++ classes via RTTI
probe.exe "rtti scan Notepad.exe --limit 10"

# pattern scan with wildcards
probe.exe "pattern 48 8B 0D ?? ?? ?? ?? 48 85 C9 client.dll --resolve 3"
3. install the claude code plugin
/plugin marketplace add vzco/arc-probe
/plugin install arc-probe
now you have 14 reverse engineering skills. claude can inject, scan, disassemble, map structs, trace writes, and build full class hierarchies — autonomously or alongside you.
say /arc-probe:inject to start, or just describe what you want: "find the function that handles player damage" and claude will orchestrate the right tools.
claude code skills
the plugin gives claude structured playbooks for common RE tasks. each skill is a step-by-step workflow that claude follows, using the probe CLI under the hood.
| skill | what it does |
|---|---|
/arc-probe:inject |
inject into a process and verify the TCP connection |
/arc-probe:analyze-module |
deep analysis of a loaded DLL — exports, RTTI classes, strings, key functions |
/arc-probe:map-struct |
map a data structure from a memory address — hex dump, RTTI, field-by-field |
/arc-probe:find-function |
locate a function by behavior, string references, RTTI, or hardware breakpoints |
/arc-probe:identify-class |
identify a C++ class from an object pointer — RTTI resolve, inheritance chain, vtable |
/arc-probe:trace-writes |
find what code reads/writes a memory address using hardware breakpoints (DR0-DR3) |
/arc-probe:find-string-xref |
trace from a known string to the code that references it via LEA RIP-relative |
/arc-probe:follow-pointers |
navigate nested pointer chains step by step with validation |
/arc-probe:make-signature |
generate a byte signature for a function that survives binary updates |
/arc-probe:resolve-rip |
resolve RIP-relative addresses from disassembled x86-64 instructions |
/arc-probe:re-handbook |
full reverse engineering reference — techniques, patterns, fallback strategies |
/arc-probe:probe-bridge |
drive the GUI via the Claude Bridge HTTP API (create structs, navigate, label) |
/arc-probe:probe-gui-struct |
build struct definitions in the GUI backed by live memory reads |
/arc-probe:probe-entity-scan |
scan and resolve game entities from a live Source 2 process |
the plugin also includes an RE assistant agent — a specialized persona with the full x86-64 calling convention reference, struct identification patterns, and Source 2 engine knowledge baked in.
how it works
probe-shell.dll          probe-inject.exe          probe.exe (CLI)
(inside target process)  (manual-map injector)     (sends commands)
        |                        |                        |
        +-- TCP server ---------|------------------------+
        |   127.0.0.1:9998      |
        +-- Command dispatcher (65 commands)
        +-- Memory engine (SEH-protected reads/writes)
        +-- Zydis x86-64 disassembler
        +-- VEH breakpoint engine (software + hardware)
        +-- RTTI scanner, PE parser
        +-- String scanner, thread inspector
        +-- MinHook function hooking
protocol: send command\n over TCP, receive {"ok":true,"data":{...}}\n. all memory access is SEH-wrapped — bad addresses return errors, never crash.
the GUI is a Tauri v2 app (Rust backend + React frontend) that connects to the same TCP server. the Claude Bridge (localhost:9996) accepts JSON POST requests to drive the GUI — create structs, set labels, navigate tabs — all programmatically.
the injector uses manual PE mapping — resolves relocations, imports, TLS callbacks, SEH/.pdata entries. the DLL does not appear in the target's module list.
what the AI can do
arc probe is designed so an AI agent can perform the entire reverse engineering workflow autonomously:
- connect to the target process and enumerate modules
- discover all functions in a module — merging .pdata boundaries, PE exports, and RTTI vtable names
- scan cross-references — find every CALL, JMP, LEA, and MOV that references a given address
- discover classes via RTTI scanning and inheritance resolution
- find globals through pattern scanning with RIP-relative resolution
- build struct definitions from schema dumps, verified against live memory
- wire pointer drill-down between structs for recursive exploration
- set breakpoints to trace what code reads/writes specific addresses
- annotate everything with labels, bookmarks, function names, and comments in the GUI
the human sees every step in the GUI as it happens. both can work simultaneously — the AI automates the tedious memory mapping while you focus on understanding the results.
# the AI sends this to build a struct via the Claude Bridge
curl -s -X POST http://localhost:9996 -H "Content-Type: application/json" -d '{
  "action": "batch",
  "actions": [
    {"action": "store", "store": "struct", "method": "createStruct",
     "args": ["C_BaseEntity", "0x439D9F49400", 1536]},
    {"action": "store", "store": "struct", "method": "addField",
     "args": ["C_BaseEntity", 852, "int32", "m_iHealth"]},
    {"action": "store", "store": "struct", "method": "addField",
     "args": ["C_BaseEntity", 816, "pointer", "m_pGameSceneNode"]},
    {"action": "navigate", "tab": "structs"}
  ]
}'
command reference
memory
| command | description |
|---|---|
read <addr> <size> |
raw bytes (hex), max 4096 |
read_ptr <addr> |
8-byte pointer |
read_int <addr> |
32-bit integer |
read_float <addr> |
32-bit float |
read_string <addr> |
null-terminated string |
read_chain <addr> <off1> ... |
follow pointer chain |
dump <addr> <size> |
hex dump with ASCII (max 256) |
write <addr> <hex> |
write raw bytes |
write_int <addr> <val> |
write 32-bit integer |
write_float <addr> <val> |
write 32-bit float |
write_ptr <addr> <val> |
write 8-byte pointer |
search & disassembly
| command | description |
|---|---|
pattern <hex> [module] [--resolve N] |
IDA-style byte pattern with ?? wildcards |
disasm <addr> [count] |
disassemble N instructions (Zydis, Intel syntax) |
disasm func <addr> |
disassemble until RET |
sig <addr> [size] |
generate a byte signature for a function |
RTTI & classes
| command | description |
|---|---|
rtti resolve <addr> |
identify C++ class from object pointer |
rtti scan <module> |
discover all RTTI classes in a module |
rtti find <name> [module] |
search for class by partial name |
rtti hierarchy <class> [module] |
get full inheritance chain |
rtti vtable <class> [module] |
vtable address and virtual function entries |
modules & PE
| command | description |
|---|---|
modules list |
loaded modules with base addresses |
modules info <name> |
detailed module info (sections, exports) |
pe header <module> |
full PE header (machine, timestamp, security flags) |
pe sections <module> |
PE sections with RVA, size, permissions |
pe exports <module> |
exported functions with RVAs |
pe imports <module> |
imported DLLs and functions |
strings
| command | description |
|---|---|
strings scan <module> |
discover printable strings in PE sections |
strings find <text> [module] |
search for specific text |
strings xref <addr> <module> |
find code that references a string address |
breakpoints
| command | description |
|---|---|
bp set <addr> |
software breakpoint (INT3) |
bp del <id> |
remove breakpoint, restore original byte |
bp list |
list all breakpoints with hit counts |
bp log [id] |
register snapshots (RAX-R15, RIP, RFLAGS) from hits |
hwbp set <addr> [r|w|x] [1|2|4|8] |
hardware breakpoint (4 slots max) |
hwbp del <id> |
remove hardware breakpoint |
threads
| command | description |
|---|---|
threads list |
all threads with TID, priority, start module |
threads info <tid> |
TEB, stack base/limit, registers |
threads stack <tid> |
walk call stack with module resolution |
registers [tid] |
dump all registers |
interfaces (Source 2)
| command | description |
|---|---|
interfaces list [module] |
walk CreateInterface registry |
interfaces vtable <name> |
read interface vtable entries |
interfaces dump <name> |
full interface analysis |
watch
| command | description |
|---|---|
watch <addr> <size> [interval] |
poll memory for changes |
unwatch <id|all> |
stop watching |
watchlist |
list active watchpoints |
65 commands total. every response is {"ok":true,"data":{...}} or {"ok":false,"error":"..."}. addresses accept hex with or without 0x prefix, and module-relative format like client.dll+0x354.
tutorials
part 1: getting started
the full walkthrough — from connecting to a live process, through RTTI discovery, pattern scanning, and building 12 annotated struct definitions with 218 fields and recursive pointer drill-down — all driven by Claude as an AI agent.
part 2: advanced static analysis
function discovery, cross-reference scanning, RTTI deep dives, vtable disassembly, Source 2 interface enumeration, and the complete agent-driven analysis workflow. 16 screenshots from a live Deadlock session.
vendor dependencies
| library | version | license | purpose |
|---|---|---|---|
| Zydis | 4.1.1 | MIT | x86-64 instruction decoder and formatter |
| MinHook | latest | BSD 2-Clause | x86/x64 function hooking |
license
ARC Probe is source-available under a commercial license. Free for personal use, education, security research, and CTF competitions. Commercial use requires a paid license.
See LICENSE for full terms.
Related skills
 Setup Matt Pocock SkillsScaffold the per-repo configuration that Matt Pocock’s engineering agent skills rely on so they understand the issue tracker, triage labels, and domain documentation la495k196k
 Lark AppsConnect Claude, Cursor or custom agents directly to Lark (Feishu) for messaging, document automation, approval workflows and enterprise data access.402k
 CavemanSlash token usage by roughly 75% while keeping every technical detail intact when working with Claude Code, Cursor or similar agents.391k94.7k
 Lark Skill MakerQuickly turn any Lark/Feishu OpenAPI call or multi-step workflow into a reusable agent skill with its own SKILL.md.386k16k
 Running Claude Code Via Litellm CopilotRun Claude Code at a fraction of the cost by routing requests through LiteLLM to the GitHub Copilot Chat API.270k72
 Codex PetGenerate a complete Codex Pet spritesheet and metadata from one reference image without needing an OpenAI key or Codex Pro.246k10